หน้าแรกของ IC Markets เข้าสู่ระบบ เว็บเทรดเดอร์ ติดต่อเรา
IC Markets Social IC Markets Social

Information Hub for
Serious Traders

  • เกี่ยวกับเรา
  • เปิดบัญชีเทรด
  • เปิดบัญชีเดโม่
  • เริ่มเทรด
  • เยี่ยมชมบล็อกของเรา
IC Markets Social
  • เกี่ยวกับเรา
  • เปิดบัญชีเทรด
  • เปิดบัญชีเดโม่
  • เริ่มเทรด
  • เยี่ยมชมบล็อกของเรา
November 30, 2021North_American_Stocks_enIC Markets

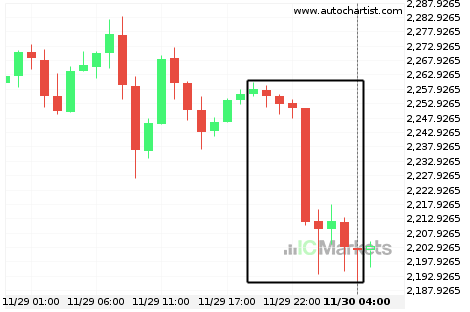
US Small Cap 2000 Index is on its way down

US Small Cap 2000 Index has experienced an exceptionally large movement lower by 2.47% from 2,256.14 to 2,202.06 in the last 9 hours.

Read more
November 29, 2021North_American_Stocks_enIC Markets

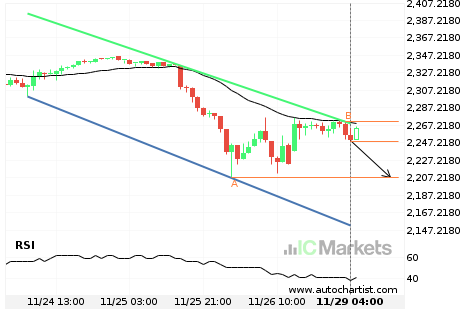
US Small Cap 2000 Index – getting close to support of a Channel Down

US Small Cap 2000 Index is moving towards a support line. Because we have seen it retrace from this line before, we could see either a break through this line, or a rebound back to current levels. It has touched this line numerous times in the last 5 days and may test it again within […]

Read more
November 26, 2021North_American_Stocks_enIC Markets

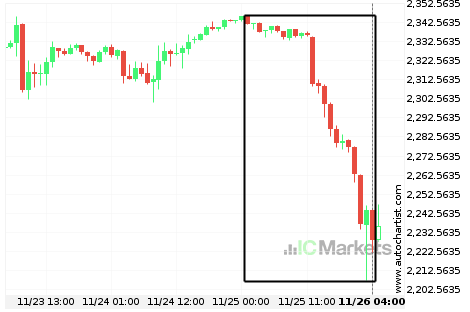
Where is US Small Cap 2000 Index moving to?

A movement of 4.84% over 2 days on US Small Cap 2000 Index doesn’t go unnoticed. You may start considering where it’s heading next, a continuation of the current downward trend, or a reversal in the previous direction.

Read more
November 25, 2021North_American_Stocks_enIC Markets

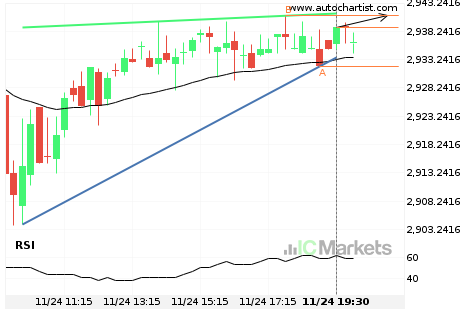
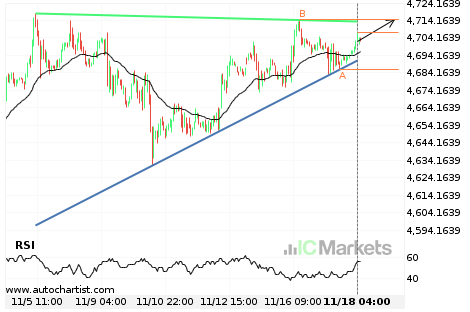
ALPHABET INC CLASS C – getting close to resistance of a Ascending Triangle

ALPHABET INC CLASS C is moving towards a resistance line. Because we have seen it retrace from this line before, we could see either a break through this line, or a rebound back to current levels. It has touched this line numerous times in the last 9 hours and may test it again within the […]

Read more
November 24, 2021North_American_Stocks_enIC Markets

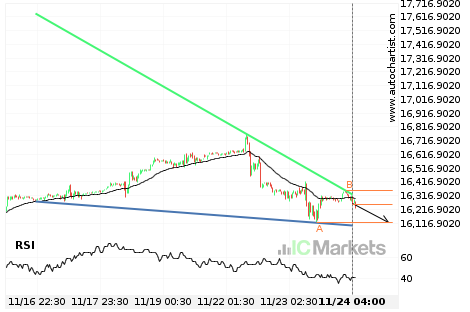
US Tech 100 Index – getting close to support of a Falling Wedge

US Tech 100 Index is moving towards a support line. Because we have seen it retrace from this line before, we could see either a break through this line, or a rebound back to current levels. It has touched this line numerous times in the last 8 days and may test it again within the […]

Read more
November 23, 2021North_American_Stocks_enIC Markets

US Tech 100 Index experienced an exceptionally large movement

For those of you that don’t believe in trends, this may be an opportunity to take advantage of an exceptional 2.18% move on US Tech 100 Index. The movement has happened over the last 19 hours. For those trend followers among you, you may think about riding this possible trend.

Read more
November 22, 2021North_American_Stocks_enIC Markets

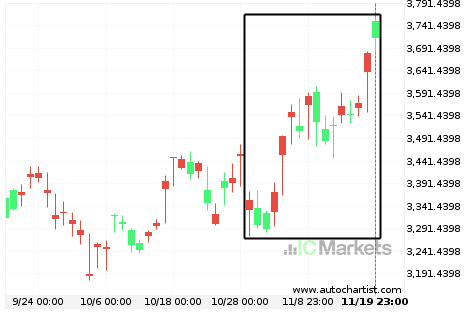
Huge bullish move on Amazon.Com Inc.

Amazon.Com Inc. has moved higher by 12.54% from 3,354.67 to 3,749.44 in the last 23 days.

Read more
November 19, 2021North_American_Stocks_enIC Markets

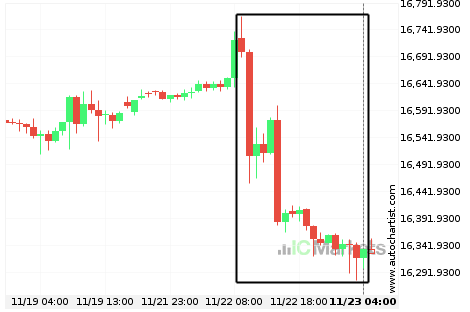
Where is US Wall Street 30 Index moving to?

A movement of 0.55% over 3 hours on US Wall Street 30 Index doesn’t go unnoticed. You may start considering where it’s heading next, a continuation of the current downward trend, or a reversal in the previous direction.

Read more
November 18, 2021North_American_Stocks_enIC Markets

Possible breach of resistance level by US SPX 500 Index

US SPX 500 Index is moving towards a resistance line which it has tested numerous times in the past. We have seen it retrace from this line before, so at this stage it isn’t clear whether it will breach this line or rebound as it did before. If US SPX 500 Index continues in its […]

Read more
November 17, 2021North_American_Stocks_enIC Markets

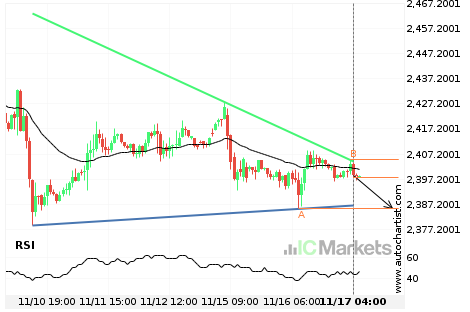
US Small Cap 2000 Index – getting close to support of a Triangle

US Small Cap 2000 Index is moving towards a support line. Because we have seen it retrace from this line before, we could see either a break through this line, or a rebound back to current levels. It has touched this line numerous times in the last 7 days and may test it again within […]

Read more
  • 1
  • 2
  • 3
  • …
  • 23
  • 24
  • 25
  • 26
  • 27
  • 28
  • 29
  • …
  • 45
  • 46
  • 47

Recent Posts

  • Either a rebound or a breakout imminent on SILVER
  • GOLD Nível visado: 2976.3601
  • A potential bearish movement on GOLD
  • มีโอกาสเกิดการเคลื่อนตัวแบบ bearish บน GOLD
  • Posible gran movimiento en el AUDJPY

Recent Comments

    Translation


     Edit Translation

    เปิดบัญชีและฝากเงินได้แบบทันที

    เทรดได้ภายในไม่กี่นาที!

    เริ่มต้น ลองบัญชีเดโมได้ฟรี

    การเทรดฟอเร็กซ์

    • ภาพรวมของบัญชี
    • เปิดบัญชี
    • ใช้งาน Web Trader

    รายละเอียดของการซื้อขาย

    • สเปรดและค่าคอมมิชชั่น
    • ขอบเขตของตลาด
    • ช่วงเวลาซื้อขาย
    • การเพิ่มเงิน
    • การถอนเงิน

    เกี่ยวกับ IC Markets

    • Help Centre
    • ทำไมถึงต้องเป็น IC Markets
    • กฎระเบียบ
    • เอกสารทางกฎหมาย
    • ติดต่อเรา


    Forex Trading

    • Accounts Overview
    • Open an Account
    • Launch Web Trader

    Trading Specifications

    • Spreads and Commissions
    • Range of Market
    • Trading Hours
    • Funding
    • Withdrawal

    About IC Markets

    • Chat with a Specialist 24/7
    • Why IC Markets
    • Regulation
    • Legal Documents
    • ติดต่อเรา

    ข้อความจำกัดความรับผิดชอบ: เนื้อหาข้อมูลนี้เป็นเนื้อหาด้านการตลาดซึ่งได้ถูกเผยแพร่เพื่อวัตถุประสงค์ในการให้ข้อมูลเท่านั้น เนื้อหานี้ไม่ได้ประกอบไปด้วยและไม่ควรถือว่าประกอบไปด้วยคำแนะนำหรือการเสนอแนะด้านการลงทุน หรือการแนะนำให้มีการดำเนินการใดๆ กับตราสารทางการเงิน วิดเจ็ตที่แสดงอยู่ภายในเป็นของผู้จัดทำจากภายนอกและ IC Markets ไม่มีส่วนรับผิดชอบใดๆ เกี่ยวกับเนื้อหาและผลกระทบที่มีต่อการเทรด

    สงวนลิขสิทธิ์สำหรับเนื้อหาทั้งหมด ความคิดเห็นของผู้จัดทำอาจไม่สอดคล้องกับความคิดเห็นของผู้จัดทำบล็อก เมื่อมีการคัดลอกเนื้อหาจากเว็บไซต์นี้หรือมีการเชื่อมโยงไปยังฟีด RSS เพื่อเผยแพร่บทความของเรา ผู้ที่ทำการคัดลอกจะต้องใส่ลิงก์ไปยัง IC Markets หรือมีการระบุแหล่งที่มาในรูปแบบ ‘IC Markets Blog’ สำหรับคำถามโดยทั่วไปโปรดติดต่อสำนักงานบรรณาธิการผ่านทางแบบฟอร์มบนหน้าติดต่อเรา

    คำเตือนเกี่ยวกับความเสี่ยง: การเทรดตราสารอนุพันธ์มีความเสี่ยงในระดับสูงกับเงินทุนของคุณและคุณควรทำการเทรดด้วยเงินที่คุณ สามารถรับการขาดทุนได้เท่านั้น การเทรดตราสารอนุพันธ์อาจไม่เหมาะกับนักลงทุนทุกท่าน ดังนั้นโปรดทำความเข้าใจกับความเสี่ยงที่เกี่ยวข้องและหาคำแนะนำที่เป็นอิสระหากจำเป็น นักลงทุนควรศึกษา Product Disclosure Statement (PDS) ก่อนทำธุรกรรมใดๆ กับเรา

    เนื้อหาข้อมูลที่ถูกแสดงอยู่บนหน้านี้เป็นข้อมูลโดยทั่วไปเท่านั้นและไม่ได้มีการคำนึงถึงสถานการณ์ส่วน ตัวของคุณ, เป้าหมายทางการเงิน หรือความต้องการของคุณ คุณเป็นผู้พิจารณาว่าผลิตภัณฑ์ต่างๆ ที่เรามีให้บริการเหล่านี้ตรงกับความต้องการของคุณหรือไม่ อีกทั้งคุณไม่ควรทำการเทรดกับเราจนกว่าคุณจะเข้าใจถึงคุณสมบัติและความเสี่ยงที่เกี่ยวข้องกับผลิตภั ณฑ์ที่เรามีให้บริการ นั่นหมายความว่าคุณอาจต้องการคำแนะนำที่เป็นอิสระก่อนที่คุณจะเริ่มต้นเทรดกับเรา

    © 2022 Raw Trading Ltd | All rights reserved.
    • Sample Page